
Answering Some Questions about Memory Analysis in Magnet AXIOM
Magnet AXIOM 2.0 has added the ability to conduct additional memory analysis by integrating the Volatility framework.
For anyone who has used Volatility in the past, it is a great command line tool to conduct memory analysis by pulling out things like processes, network connections, command history, files, etc. The integration should be familiar to anyone who has used both AXIOM and Volatility before, but if you haven’t used Volatility in the past, here are a few tips and tricks on the workflow to help you get started. We’ve also made a quick walkthrough which you can watch here:
Why Use AXIOM & Volatility Together Instead of Running Each Tool Separately?
Aside from the obvious benefit of having both tools available in a GUI, there are many reasons you may want to run your memory image through AXIOM with the Volatility integration:
- Combined artifacts from AXIOM and Volatility — Aarved computer artifacts from AXIOM and common plugins from Volatility.
- Evidence integration — Analyze computer, memory, smartphone, and cloud data all in one spot.
- Better Analysis — Once all evidence is processed, sort, filter, timeline, use connections, report, etc. on data across all sources of evidence. This is especially valuable when trying to build timelines or connections between artifacts and files that span across different evidence sources such as a computer and the captured memory.
- It’s faster — Running all the plugins at once allows you to get your results faster instead of running each plugin separately via the command line.
What Artifacts Does AXIOM Collect from Memory?
AXIOM has always supported memory analysis. It would carve through a memory image looking for many of the same artifacts found on a computer image such as browsing activity, files like documents, LNK files, Event Logs, Gmail webmail, among many others. The integration of Volatility allows us to pull additional memory artifacts that AXIOM didn’t support previously such as processes, network connections, DLLs, etc.
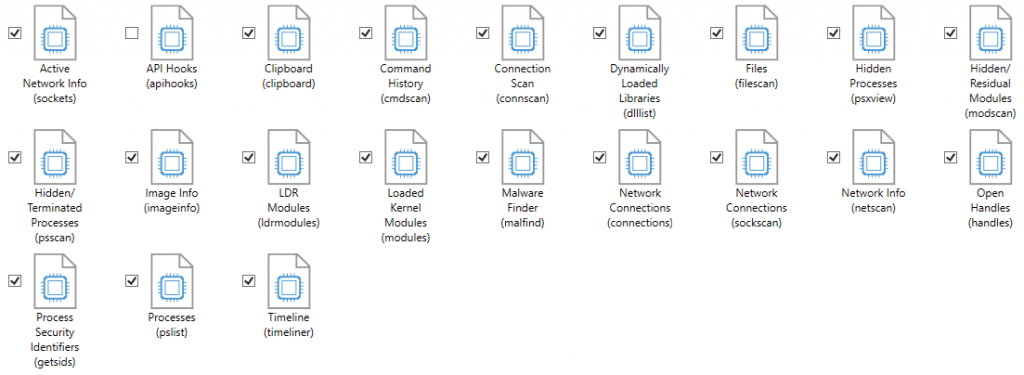
In the artifact selection screen, we provide a list of all the Volatility plugins that have been integrated into AXIOM. The artifact has a name and then in brackets it shows the plugin name from Volatility so that users who are familiar with the Volatility plugins are able to identify the ones they want. Not all plugins are available but most of the popular ones are and we are open to adding many others in the future as requested.
What Image Types Does it Support?
AXIOM is able to handle many image types including E01/Ex01, raw/dd, Virtual Machines, etc. Volatility also supports many image types as well (raw/dd, bin, vmem, etc.). In order to run both the AXIOM artifacts and Volatility plugins, you’ll need to have an image type supported by both tools, luckily there are many types.
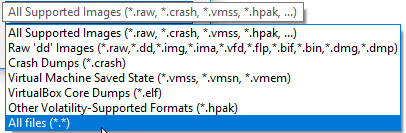
Even if your memory is in a different format than the ones listed above, if it is just a raw dump (for example a .mem file from FTK Imager) you can still load it by either selecting “All Files” from the drop down or renaming the extension to something that is supported.
Why Does it Take a Long Time to Load a Memory Image into AXIOM?
When loading a memory image into AXIOM, the first thing you are asked is whether you want to select a profile or have AXIOM choose one for you. If you know the OS type that it came from (ex. Win7SP1x64) you can select the profile and it will load immediately. If you don’t know which profile to load you’ll want to let AXIOM scan the image and choose for you.
If you’ve ever used Volatility before, this scan is equivalent to running the KDBGscan plugin to determine the OS and if the OS is newer such as Win8 or Win10, it could take some time to map everything out. Most memory images Win7 or older will load after a few minutes but for Win8+ images, the KDBGscan will take some time (could take an hour depending on the size of the image). This is consistent with the time it takes in Volatility as well and is required to successfully run any of the additional plugins later, otherwise you may get incorrect or incomplete results.
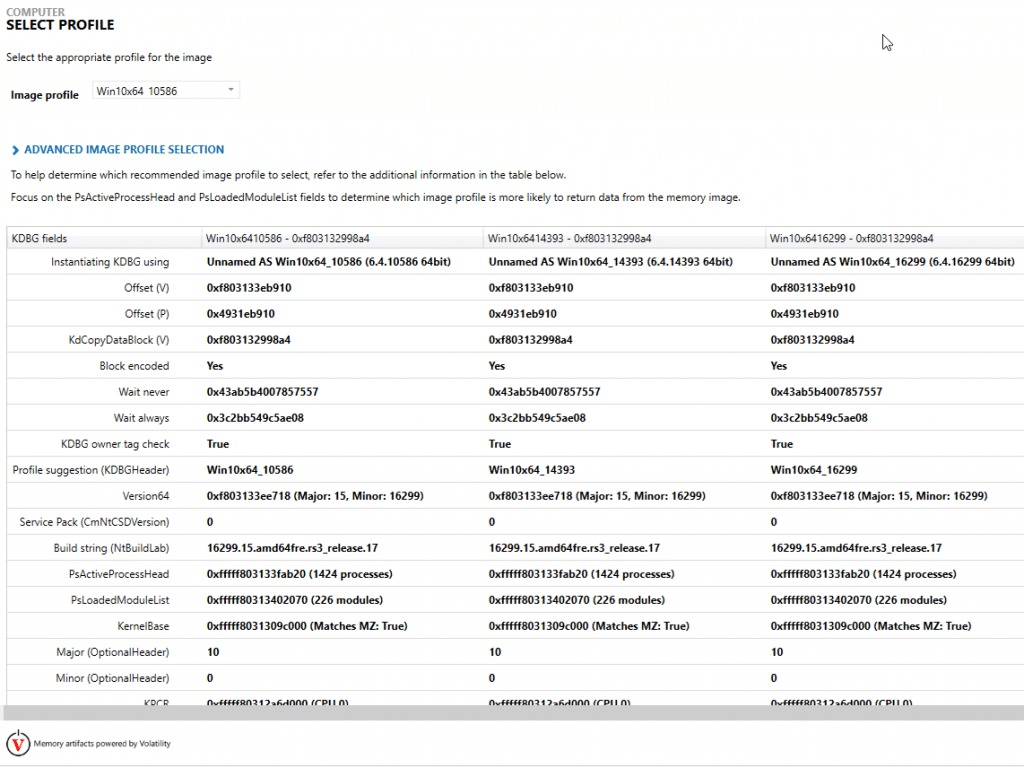
The KDBGscan is usually pretty good but not always 100% accurate in selecting the correct profile so you may need to go back and scan again with a different profile if your analysis is incorrect but for the most part it works quite well at identifying a profile that works.
What Does X Artifact/Plugin Mean?
Each artifact has a different purpose depending on the goals of your investigation. For example, the psxview plugin will show hidden processes by comparing the output from pslist and psscan and making note of any processes that appear in one but not the other.
For more information about specific plugins or artifacts, check out the Artifact Reference Guide available in the help file for AXIOM or Volatility’s command reference.
If you have any additional questions, feel free to reach out at jamie.mcquaid@magnetforensics.com
Thanks,
Jamie McQuaid